Nature is a great love of mine, so it made sense to combine it with my passion for infographics.
Anti-climactic is a series of simple and straightforward infographics on climate change and natural resources.
Below is Part1 of the series, if you want to see more, here’s Part2 and Part3.

The chapters
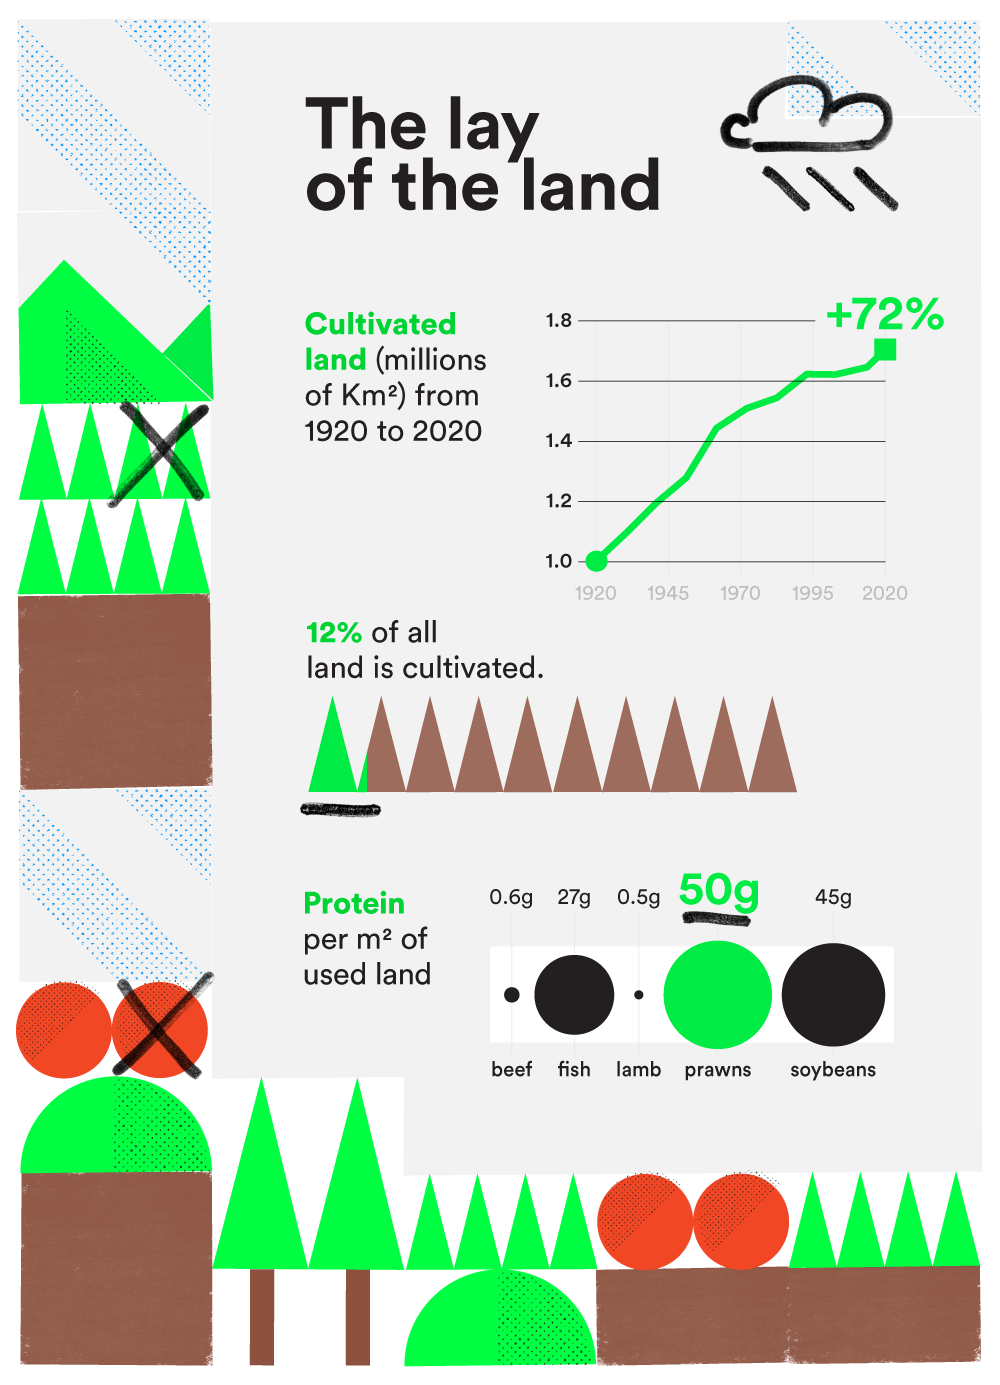
The first infographic focuses on how land is used and how efficient some of its uses are in producing food.
Sources:
Our World in Data
The World Factbook
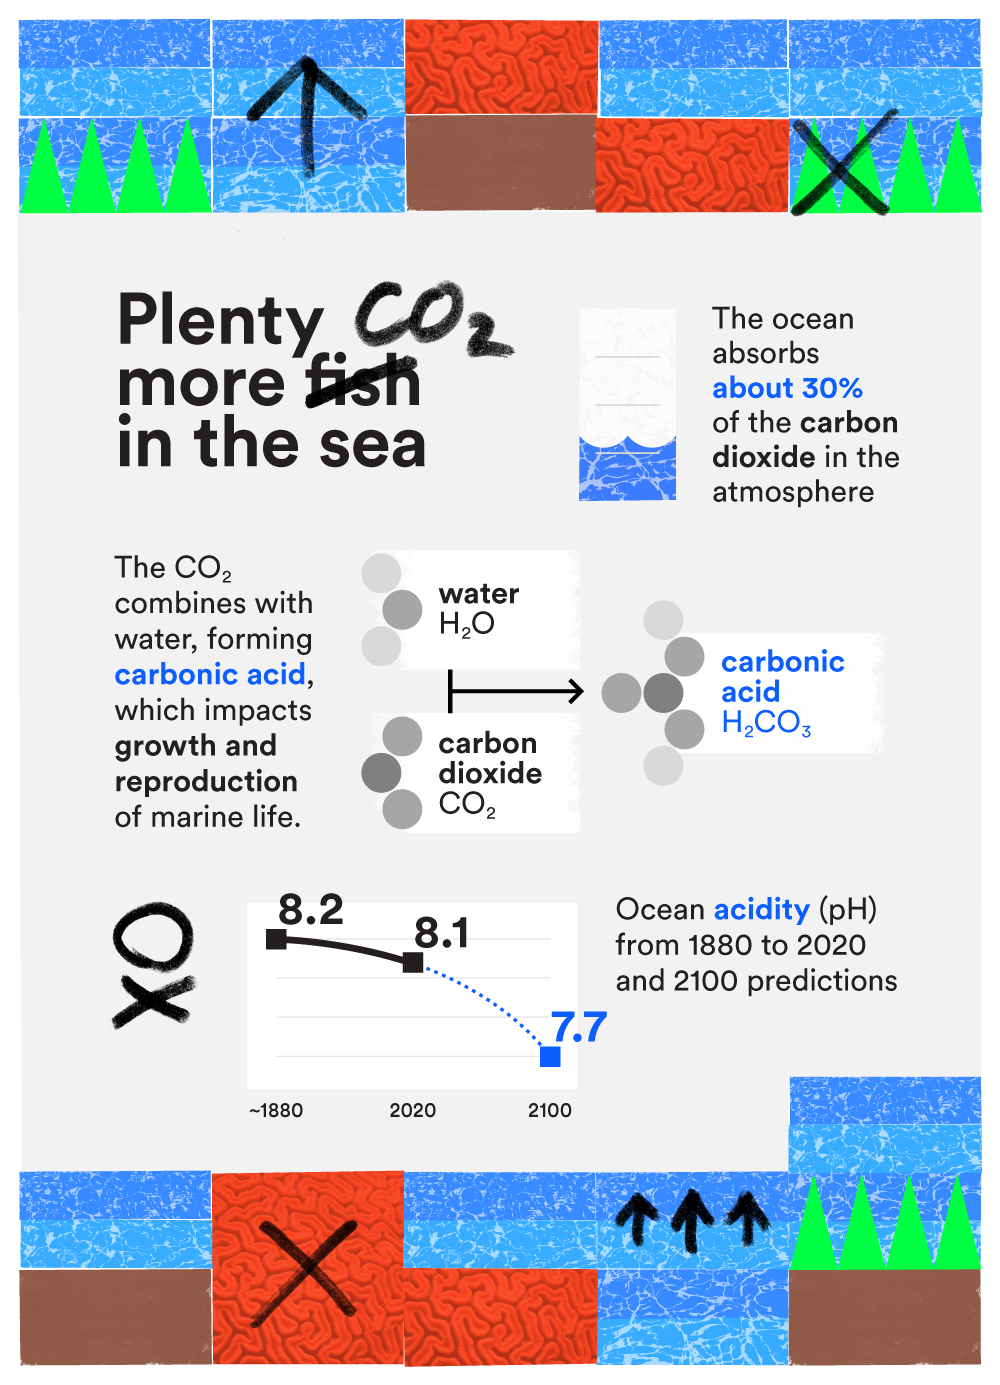
The theme of the second infographic is ocean acidification, i.e., seawater becoming more acid due to CO₂ emissions.
Sources:
Pacific Marine Environmental Laboratory
Smithsonian Institution
National Geographic
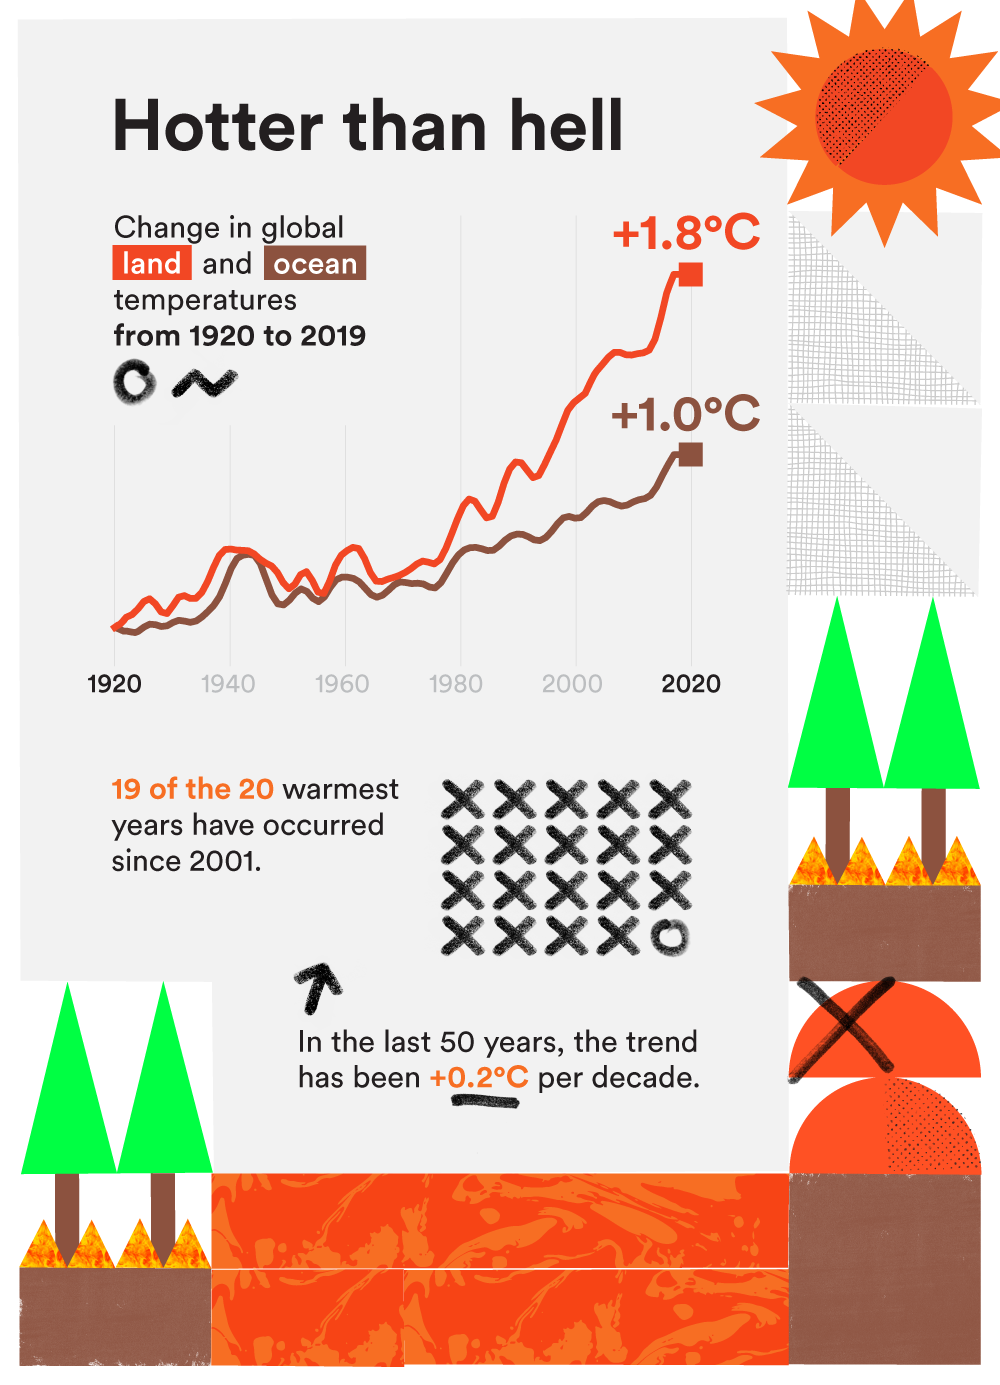
The third infographic of the first part hinges on rising temperatures and how critical the situation is getting.
Sources:
National Centers for Environmental Information
Nasa