Nature is a great love of mine, so it made sense to combine it with my passion for infographics.
Anti-climactic is a series of simple and straightforward infographics on climate change and natural resources.
Below you will find the infographics divided into Part1, Part2 and Part3, each having a specific design language and overarching theme.
Part1
Tracking the fundamental shifts in Earth’s core systems, from the efficiency of land cultivation to the rising heat and silent acidification of our oceans.

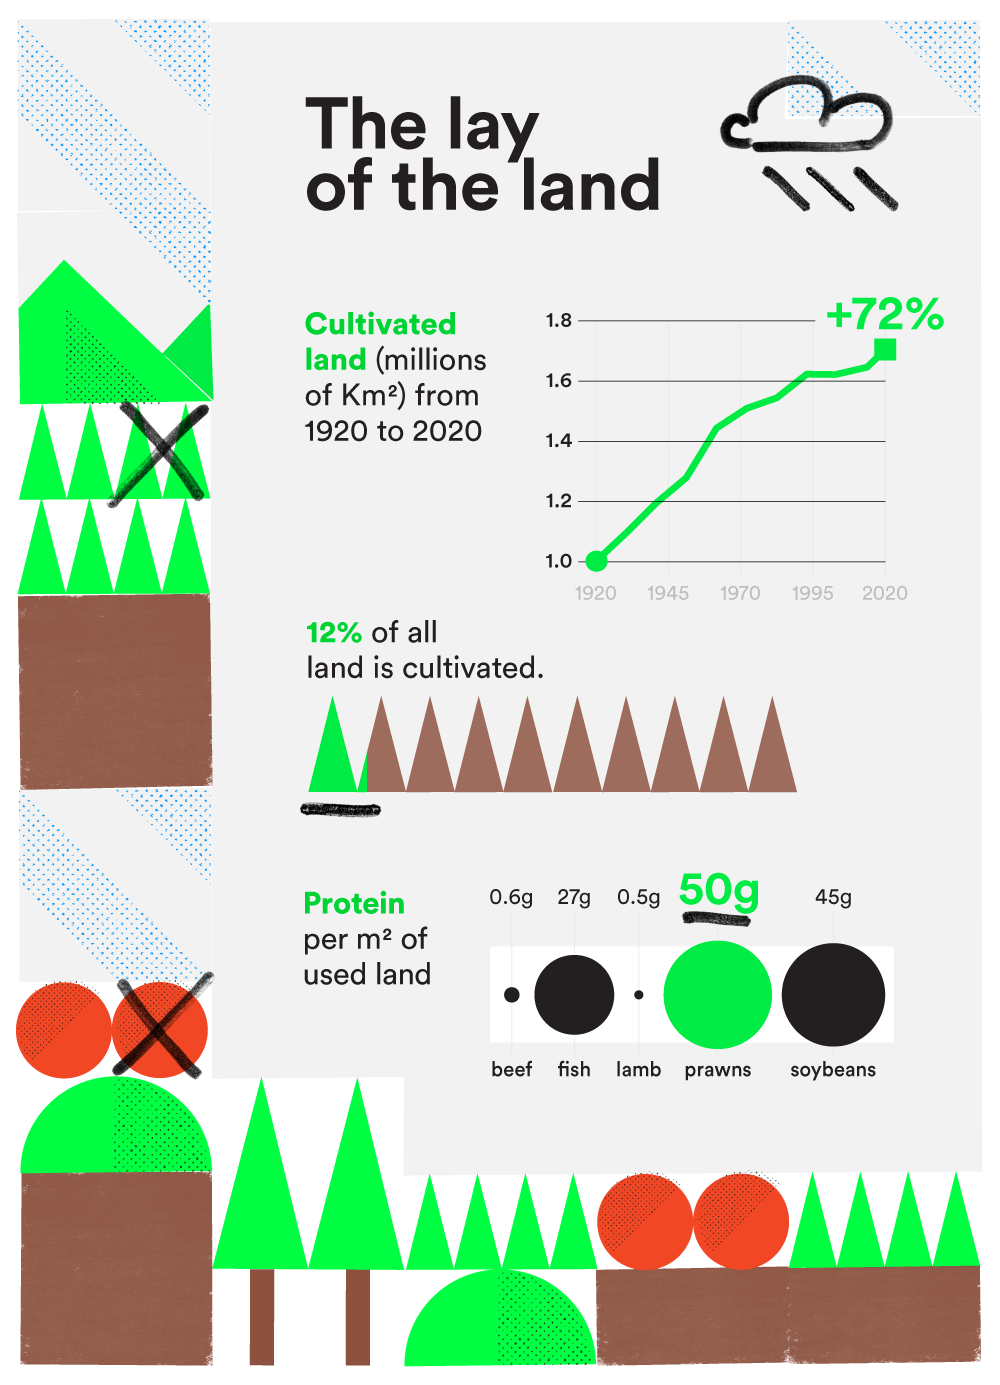
Land use
The first infographic offers a deep dive into land cultivation and why your choice of protein matters for the planet.
Sources:
Our World in Data
The World Factbook
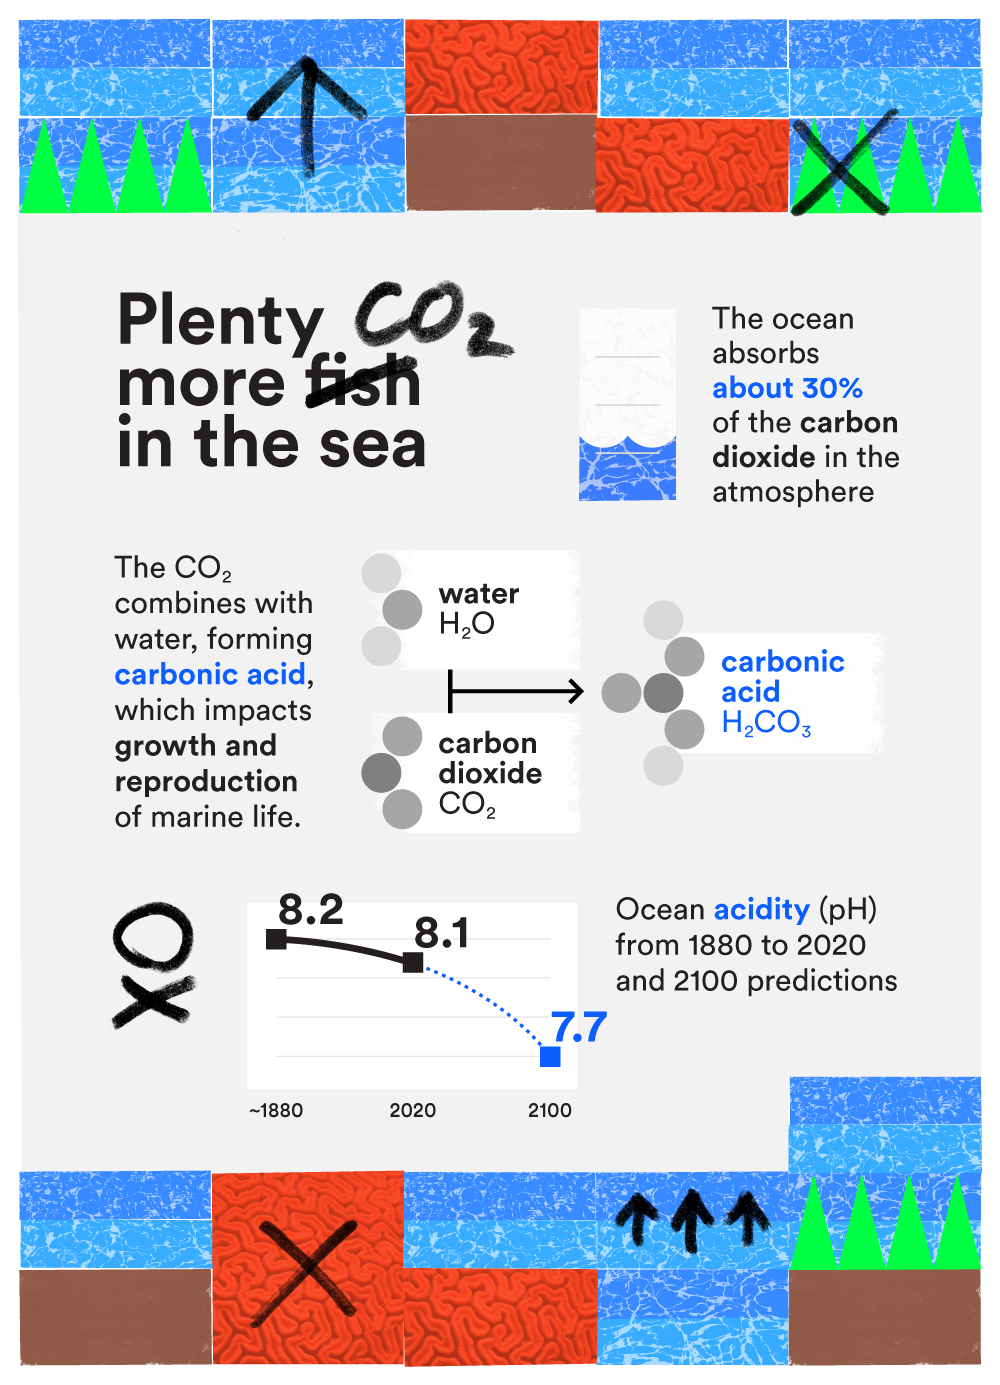
Ocean acidification
The theme of the second infographic is ocean acidification, i.e., how the sea is absorbing our carbon habit and the acidic price marine life pays.
Sources:
Pacific Marine Environmental Laboratory
Smithsonian Institution
National Geographic
Rising temperatures
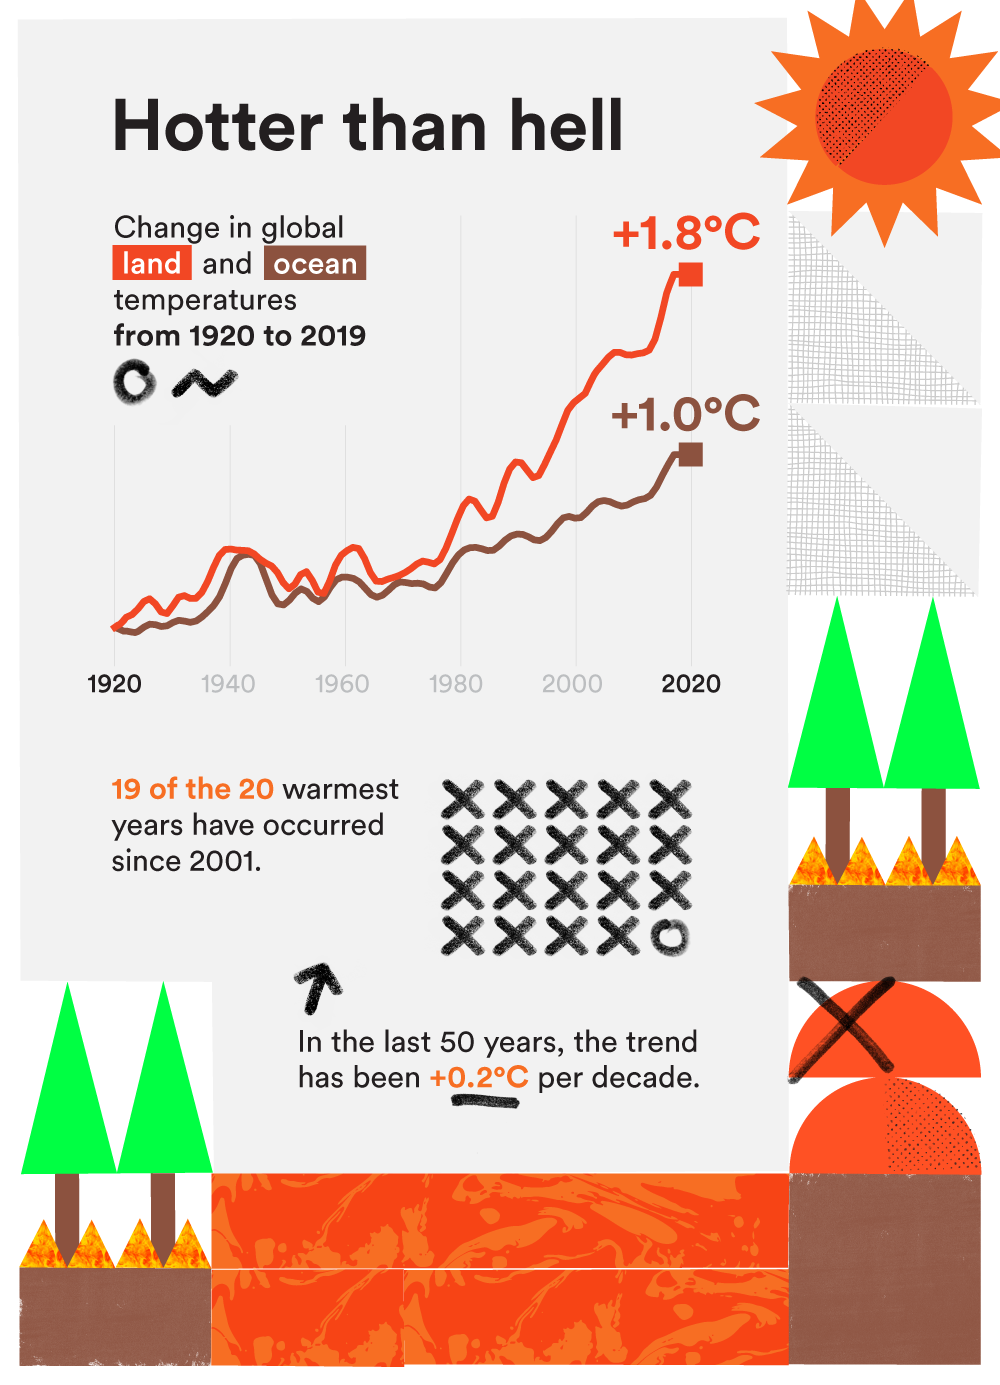
The third infographic of the first part hinges on rising temperatures and how critical the situation is getting.
Sources:
National Centers for Environmental Information
Nasa
Part2
Investigating the physical toll of our consumption cycle, where the thirst for oil and the weight of plastic waste accelerate the degradation of our land.
Desertification
The theme of the first chapter is desertification, its causes and repercussions and the high water stress facing half the world by 2030.
Sources:
Nature.com
United Nations Convention to Combat Desertification
World Atlas of Desertification

Waste
The second chapter is about our waste management crisis, in particular the huge problem of plastic waste, and the urgent countdown to zero landfill waste.
Sources:
American Association for the Advancement of Science
The World Bank
The Ocean Health Index

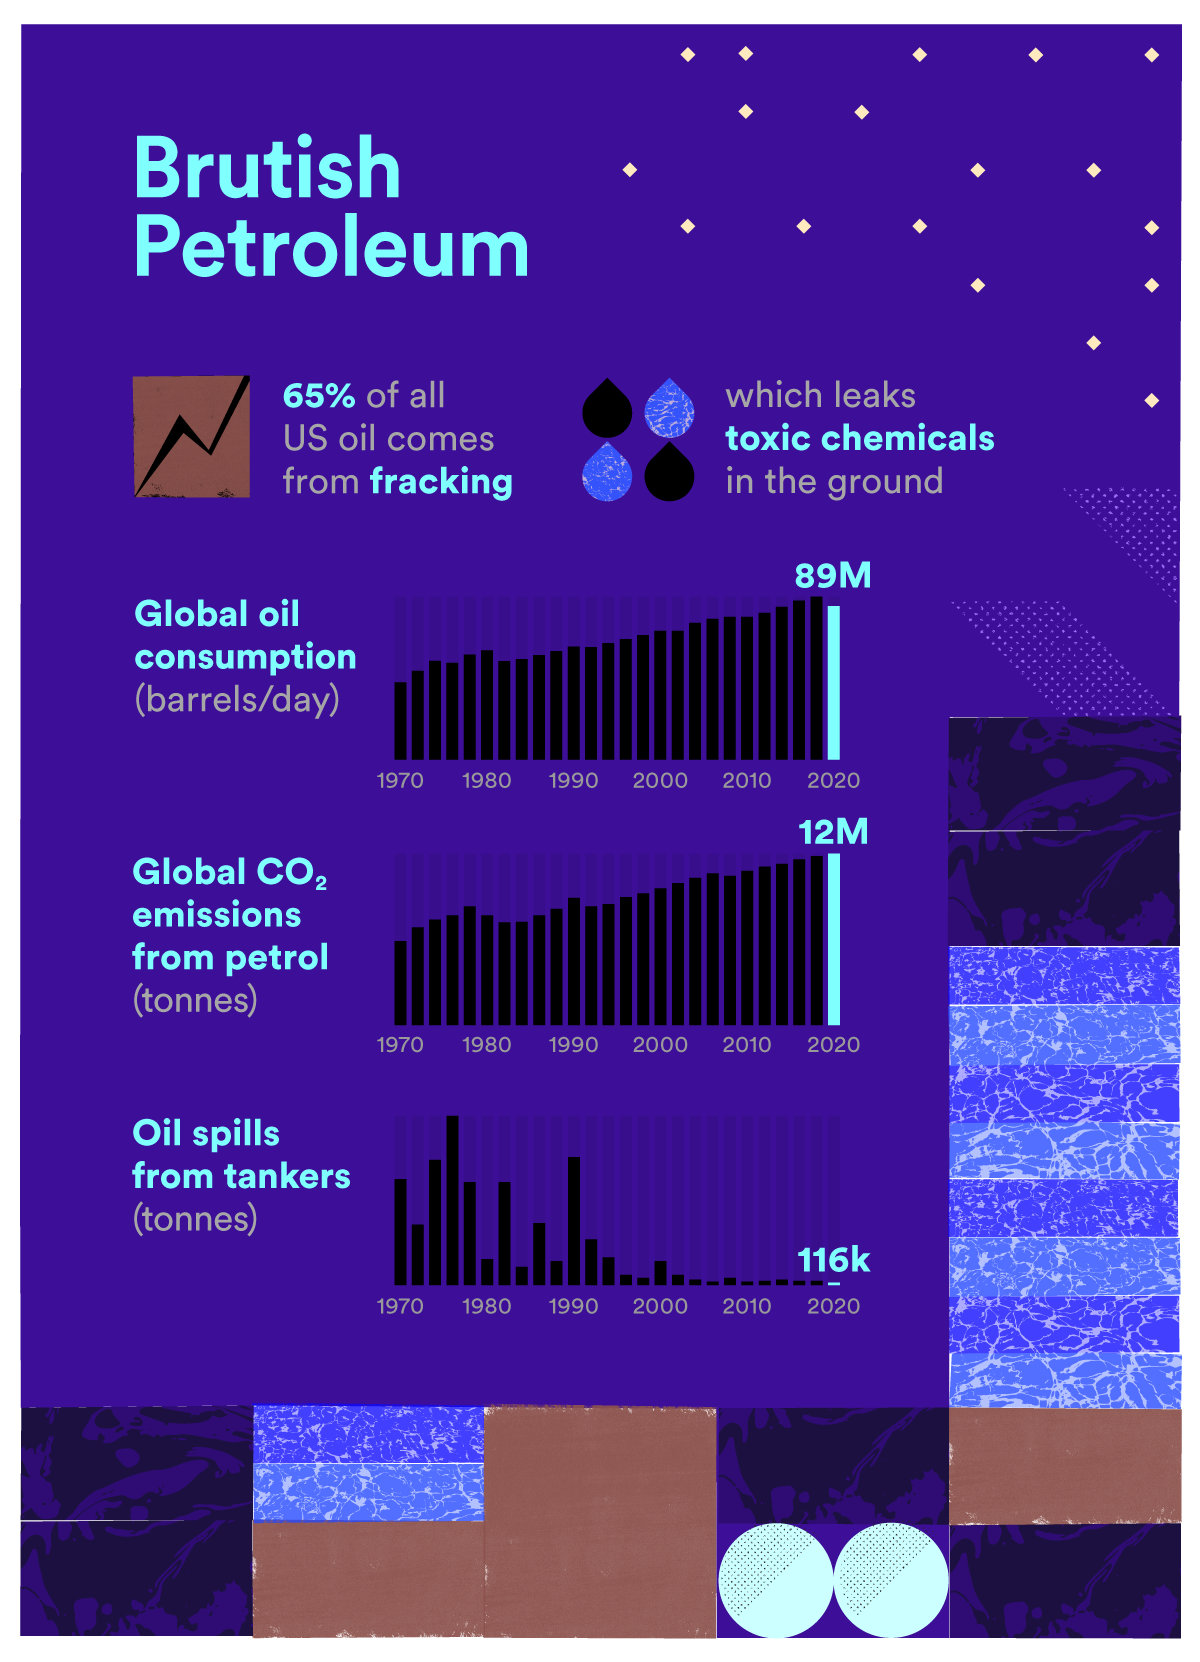
Crude oil
Crude oil and its use are the third theme, focusing on the link between its obtainment and the environment and tracking the messy footprint of our petroleum reliance.
Sources:
Forbes
British Petroleum
U.S. Energy Information Administration

Part3
Bridging the gap between mass production and urban mobility, illustrating how factory emissions and transport habits return to us through the chemistry of our atmosphere
Acid rain
The first theme is how gasses like sulfur dioxide and nitrogen oxides cause acid rain and how global policies are finally clearing the air.
Sources:
U.S. Environmental Protection
Greenpeace
Britannica

Cars
The second theme is transportation, more specifically cars, offering a comparison of transport footprints and the roadmap toward an electric-car future by 2030.

Factories
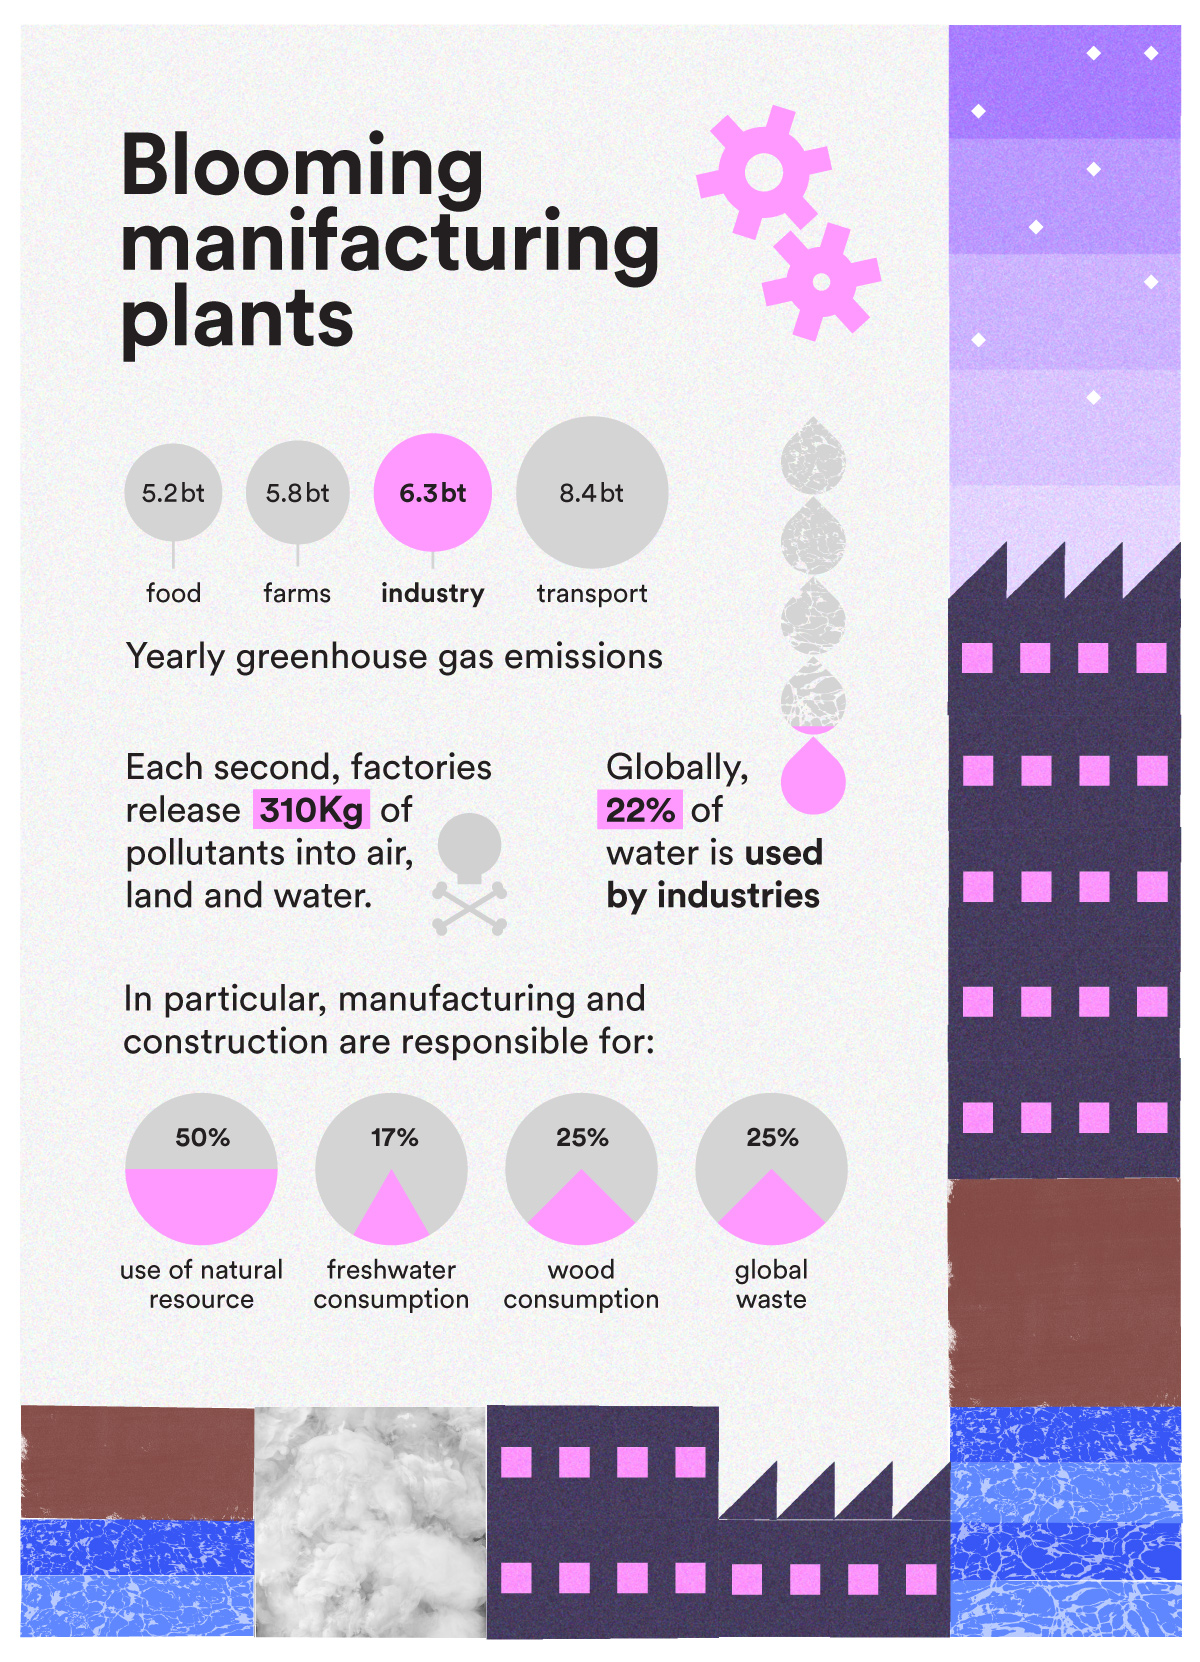
The third and last theme is factories and how they impact the environment with their use of natural resources and the amount of pollutants released.
Sources:
Worldometer
Heal the planet
UNESCO